
On Wednesday Bitcoin (BTC) price blasted through a series of key resistance levels as traders ponied up and set their target on the $9K mark. According to data from Cointelegraph Markets and CoinMarketCap the BTC/USD pair has rallied approximately 14.5%, notching a $1,123 gain.
With the block reward halving just 13 days away, bullish investors are hopeful that a push above $9,000 will lead to a pre-halving price of $10,000. Let’s take a brief look at the charts to see what Bitcoin is up to.
Crypto market daily price chart. Source: Coin360
Today’s $1,123 surge allowed Bitcoin price to clear a number of crucial levels of concern. Among them were the: resistance at $8,000, the 61.% Fibonacci retracement, the 100 and 200-day moving average and expected resistance at $8,500.
The move above $8,000 was much needed as the yearly pivot was cleared at $8,100 and the surge above $8,500 will have some traders convinced that Bitcoin’s market structure has shifted and the trend is now bullish.

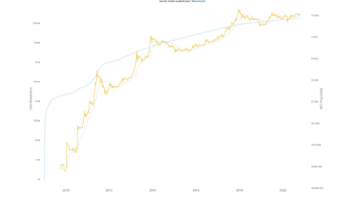
BTC USDT daily chart. Source: TradingView
After such a strong upside move, many traders will be looking for the price to pull back to test underlying support or even the 61.8% Fibonacci retracement. At the time of writing,the relative strength index is rising closer to overbought territory on the daily timeframe and the Stoch RSI is already overbought.
Earlier in the day Cointelegraph contributor filbfilb said that at $8,700 the current rally is looking over-extended and the chart below suggests Bitcoin in need of a retest of underlying supports.

BTC USD daily chart. Source: TradingView
Some will argue, and rightfully so, that these indicators can’t fully be relied on when Bitcoin price makes $1,000+ rallies on surging purchasing volume as the asset is known to keep pushing higher even when the RSI and MACD flash overbought. Thus, keeping a closer eye on shorter time frames like the 60-min chart is wise as it will be easier to spot increases in sell volume and possible reversal patterns.
Bullish outlook
Bitcoin price has already set a higher-high above the March 8 high at $8,915 and currently the price rests on a high volume VPVR node at $8,800. While a retest of previous resistance levels below this price should be expected, a bullish scenario would entail Bitcoin price finding support at $8,800.
For this to occur, buy volume would need to carry on as it has done for the majority of today and this would strengthen the possibility of an attack on the 71.8% Fib level at $9,060. Doing so would open the opportunity for traders to exploit a small volume gap on the VPVR and also open the door for the price to ascend to $9,200 resistance level.
From this point Bitcoin is expected to encounter some difficulty in the $9,200 to $9,400 zone where there is another high volume VPVR node.
A less bullish outlook
Barring spooky gifs and cryptic Bitcoin will crash and burn-style tweets from the likes of Bitcoin whales like Joe007, it’s not easy to imagine a short term bearish scenario for Bitcoin price. Obviously, anything can happen and the recent 50% collapse in Bitcoin price on March 13 remains the best example of how quickly the market can turn against investors.
A 15% gain is nothing to laugh about and vertical movements such as the one witnessed today slice through resistance levels but also don’t build solid supports as the normal phases of consolidation are bypassed.
Historically, the 61.8% Fib level has been one of the most important for Bitcoin’s price action as it often functions as a stiff resistance and a strong support depending on Bitcoin’s market structure.
As mentioned earlier, a retest of recent lows or resistance levels is normal behavior exhibited by assets across all markets after a rally and the Bitcoin daily chart shows that there is a VPVR volume gap from $8,560 to $7,700.
If the price begins to look toppy and traders begin booking profits, momentum will slow, clever traders will open short positions, and as selling volume begins to outpace purchasing volume an evental retest of $8K and/or the 61.8% Fib level at $7,927 is possible.
In the event that the price fails to bounce off the 61.8 Fib level, $7,700 and $7,450 are the expected levels of support where traders will likely place bids. If the price fails to hold at the $7,450 support then there’s a problem and traders will start screaming ‘trend-change’.
Investor sentiment improves as the halving approaches

Crypto Fear & Greed Index. Source: Alternative.me
Nonetheless, today was a fantastic day for bullish traders and as the halving approaches perhaps there will be repeat performances. The Crypto Fear & Greed Index shows noticeable improvement as the sentiment metric now reads 26.
While the index still shows investors are fearful about Bitcoin’s prospects, it’s a big improvement from last week’s “Extreme Fear” reading and the metric is set to update 5 hours, meaning today’s 15% rally may not be reflected in the current measurement.
The views and opinions expressed here are solely those of the author and do not necessarily reflect the views of Cointelegraph. Every investment and trading move involves risk. You should conduct your own research when making a decision.

Comments (No)