
Bitcoin is at a strong support level. If it fails to bounce quickly, it is likely to turn negative. Let’s analyze the charts.
This week, major cryptocurrency exchange Binance stated that it plans to take a conservative approach and that Venus project will comply with all the regulatory requirements. This will keep it away from the hurdles that Facebook’s Libra project currently faces.
The total market capitalization of cryptocurrencies has dipped below $250 billion. Since mid-July, crypto markets have rebounded from close to this level on many occasions. Mike Novogratz believes that the Bitcoin (BTC) bull market is still alive and the current drop is only a consolidation before institutional investors jump in.
Brevan Howard’s co-founder Alan Howard is planning a $1 billion hedge fund in the crypto space. The venture will help institutional investors benefit by guiding them to funds that have been selected after detailed due diligence. This would allow investors to design portfolios according to their risk profile.
Should traders utilize this opportunity to go long or is there a risk that the decline can deepen further? Let’s analyze the charts.
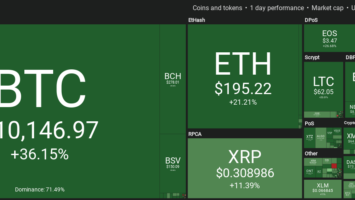
BTC/USD
The tight range trading in Bitcoin was resolved to the downside. It broke the sequence of higher lows on Aug. 28 and dipped below the support line of the symmetrical triangle on Aug. 29. It has a strong support at $9,080, which is a critical level to watch out for. If the price slips and sustains below $9,080, it is likely to drop to $7,451.63. Such a move will leave a dent in the sentiment and could delay the uptrend resumption.

Both moving averages have started to turn down and RSI has dipped into the negative territory, which suggests that bears have the advantage in the short-term.
Our point of view will be invalidated if bulls defend $9,080 once again and propel the BTC/USD pair above the moving averages. This will confirm $9,080 as a strong floor, which can be used as a good stop loss point for future trades.
Depending on the price action during the next few days, we might suggest traders initiate long positions above $11,000 instead of waiting for a breakout above the downtrend line, as recommended in our earlier analysis. Until then, traders can remain neutral on the cryptocurrency.
ETH/USD
Ether (ETH) turned down from the overhead resistance of $192.945 and plunged below the support at $174.461 on Aug. 28. Both moving averages are sloping down and RSI is close to oversold levels, which shows that bears have the upper hand. The next support on the downside is at $150.

Our negative view will be invalidated if the ETH/USD pair reverses direction from the current levels and quickly rallies above $192.945. Such a move will indicate that the current breakdown was a bear trap. However, as the pair has failed to hold on to support levels, we will withdraw our buy recommendation given in an earlier analysis. We will turn positive after we spot a reliable buy setup.
XRP/USD
XRP has been holding the first support at $0.24508 for the past two days. However, failure to rebound strongly from a critical support shows a lack of aggressive buying. Both moving averages are trending down and RSI is close to oversold levels, which shows that bears are in command.

A break below $0.24508 can result in a retest of the yearly low at $0.225. If this support also cracks, the downtrend can extend to $0.19.
Conversely, if the XRP/USD pair bounces off the current levels and rises above 20-day EMA, it will indicate a likely change in the trend. As the trend is down, we suggest traders remain on the sidelines.
BCH/USD
Bitcoin Cash (BCH) broke below the trendline of the ascending channel on Aug. 28. It is currently at the neckline of the head-and-shoulders (H&S) pattern, which is an important level to watch out for. If the price closes (UTC time) below the neckline, it will complete the H&S pattern, which will be a huge negative.

Following the completion of the H&S pattern, the first support to watch on the downside is $166.98 and if that fails to hold, the next support is way lower at $105.
However, the BCH/USD pair has rebounded off the neckline twice since July 15. If the pair turns around from the current levels and breaks out of both moving averages, it can result in a move to $360. We do not see any buy setups at the current levels, hence, we are not suggesting a trade in it.
LTC/USD
Litecoin (LTC) plummeted below the support of $69.9227 on Aug. 28. It can now drop to the next support at $58. The trend remains bearish as both moving averages are sloping down and RSI is in the oversold zone.

If $58 also fails to hold, the LTC/USD pair might drop to $49.3305, which is 78.6% Fibonacci retracement level of the entire rally. As the RSI is in oversold territory, we anticipate a relief rally to retest $69.9227. If the price breaks out and sustains above this level, it can reach the downtrend line. However, if the price turns down from $69.9227, the downtrend will resume. We would wait for a reversal pattern to form before suggesting a trade in it.
BNB/USD
Binance Coin (BNB) plunged below the strong support of $24.1709 on Aug. 28, which is a bearish sign. Both moving averages have turned down and RSI is in the oversold zone, which shows that sellers have a clear advantage. It can now decline to the next support at $18.3.

After every breakout from a critical level, there is a retest of the breakdown level. Therefore, we anticipate a retest of $24.1709 within the next few days. If the retest is successful, the BNB/USD pair will resume its down move and will reach $18.3. However, if bulls push the price above $24.1709 and sustain it, a move to 50-day SMA is probable. As the sentiment is negative, we suggest traders remain on the sidelines.
EOS/USD
EOS broke below the critical support of $3.3 on Aug. 28. After breaking down a critical level, the price usually continues lower as bulls hurry to close their positions. However, the cryptocurrency found support at $3.06 on Aug. 29, which is a positive sign. It shows that bulls are not panicking and are buying at lower levels.

If the EOS/USD pair rises back above $3.3 and sustains it, bulls will again try to push it above 20-day EMA. If successful, it will indicate a likely change in the trend because the pair has not sustained above 20-day EMA since breaking down on Jun. 26. Therefore, we retain the trade proposed in an earlier analysis.
Our view will be invalidated if the price turns around either from the current levels or from 20-day EMA and plunges below $3.06. If that happens, a decline to $2.76 will be on the cards.
BSV/USD
Bitcoin SV (BSV) continues to trade below the downtrend line and both moving averages. This shows that bears have the upper hand. On Aug. 29, bears broke below the immediate support of $123 but could not sustain below it. This shows some buying at lower levels.

The bulls will now attempt to propel the BSV/USD pair above 50-day SMA within the next few days. If successful, the pair can move up to $188.69. We will suggest a trade after the price sustains above 50-day SMA.
However, if the price fails to break above the moving averages, we expect bears to make another attempt to sink the price to the next support of $107.
XLM/USD
Stellar (XLM) resumed its downtrend as it broke below $0.065 support on Aug. 28. Its next support is at $0.058325 and if that also cracks, the decline can extend to $0.05. As the price has broken down to the new yearly lows, we withdraw the buy recommendation given in the previous analysis.

The downsloping moving averages and RSI close to the oversold zone show that bears are in the driver’s seat. Our negative view will be invalidated if bulls scale and sustain above the previous support turned resistance of $0.065. If that happens, the XLM/USD pair can move up to $0.072545. We will wait for a new buy setup to form before proposing a trade in it.
ADA/USD
Cardano (ADA) has risen to the tenth place in terms of its market capitalization, hence, has found a place in our analysis once again. It remains in a downtrend as the price is quoting below downsloping moving averages and RSI is in the negative zone. However, we spot a falling wedge pattern and a bullish divergence on the RSI, which indicates the probability of a trend reversal.

A breakout and closing (UTC time) above the wedge will be the first sign that the downtrend is over. We will wait for the ADA/USD pair to sustain above the wedge before recommending a long position.
Our view will be negated if the pair turns down from 20-day EMA once again and breaks down off the wedge. Such a move can result in a fall to $0.035778.
The views and opinions expressed here are solely those of the author and do not necessarily reflect the views of Cointelegraph. Every investment and trading move involves risk. You should conduct your own research when making a decision.
Market data is provided by HitBTC exchange.

Comments (No)