Bitcoin has resumed its uptrend. Can it break out of the recent highs? Let’s analyze the charts.
The views and opinions expressed here are solely those of the author and do not necessarily reflect the views of Cointelegraph. Every investment and trading move involves risk. You should conduct your own research when making a decision.
Market data is provided by the HitBTC exchange.
The trade war between China and the United States intensified as China allowed its currency, the yuan, to fall to its lowest level since 2008. This is seen as a retaliatory move by China on the latest tariff hikes by the U.S. If the nations enter into a currency war, it will only strengthen the case for cryptocurrencies and investors are likely to flock to digital assets to protect their investments. Unlike the previous crypto bull market that had risen on hope and future prospects of cryptocurrencies, the current bull phase is being buoyed by strong fundamentals.
Galaxy Digital CEO Mike Novogratz said that macroeconomic conditions and geopolitical unrest have given “real legs” to Bitcoin’s current rally. Anthony Pompliano of Morgan Creek Digital Assets said that Bitcoin is responding appropriately to global instability. Max Keiser, host of the RT program Keiser Report, expects the momentum in Bitcoin to carry it to $15,000 this week alone.
The total market capitalization of cryptocurrencies has risen to $311 billion and Bitcoin’s dominance has hit 67.8%. This shows that Bitcoin is leading from the front. How far can this rally continue and which altcoins are likely to participate in the rally? Let’s find out.
BTC/USD
Bitcoin (BTC) broke above the moving averages on Aug. 3 and triggered our buy recommendation given in an earlier analysis. It is now attempting to sustain above the downtrend line. If successful, it will indicate buying at higher levels that can carry the price to $13,156.96 and above it to the recent high of $13,973.50. If the digital currency hits new yearly highs, it can rise to $17,208.84 and above it to lifetime highs.
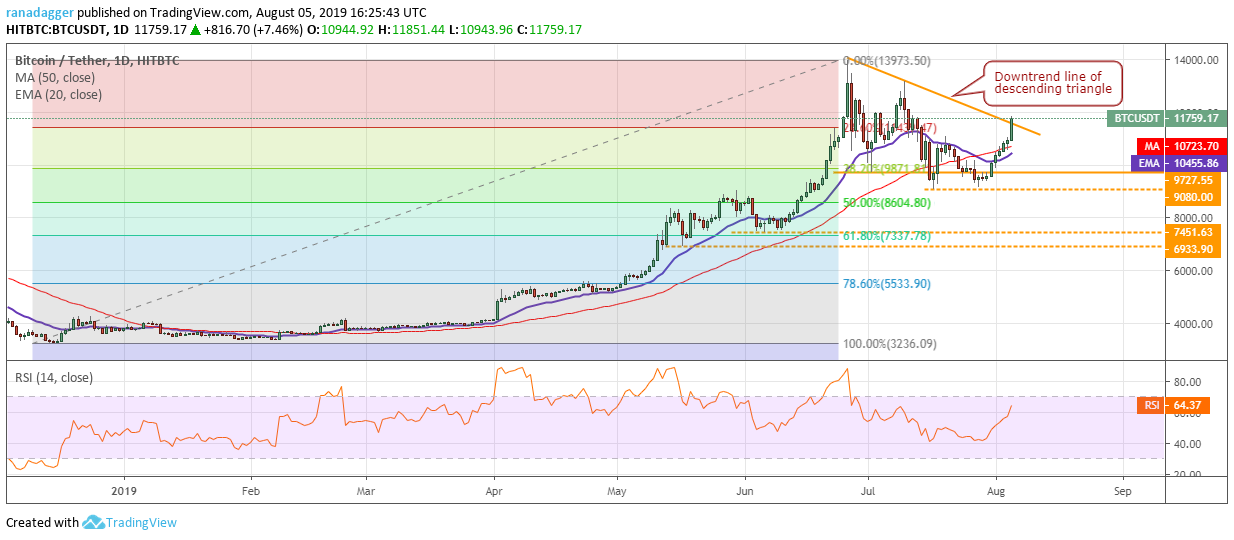
The BTC/USD pair was forming a descending triangle. However, a breakout and close (UTC time frame) above the downtrend line invalidates the bearish setup. The failure of a bearish pattern is a bullish sign. It forces the short sellers to cover their positions resulting in a short squeeze. The momentum following the breakout of the downtrend line will provide more insight on how fast can the pair reach $13,973.50.
Both moving averages are sloping up and the RSI is in positive territory, which suggests that bulls have the upper hand. While all signs on the chart point to a rally, the traders should be ready for any eventuality.
If bears sink the price back below the downtrend line, it will indicate a lack of buyers at higher levels. There is support at both moving averages, below which the bears will gain the upper hand.
ETH/USD
Ether (ETH) has broken out of the 20-day EMA and has reached the overhead resistance of $235.70. A breakout and close (UTC time frame) above this level is likely to resume the uptrend that can carry the price to $320.84. The traders can buy as suggested in our earlier analysis.
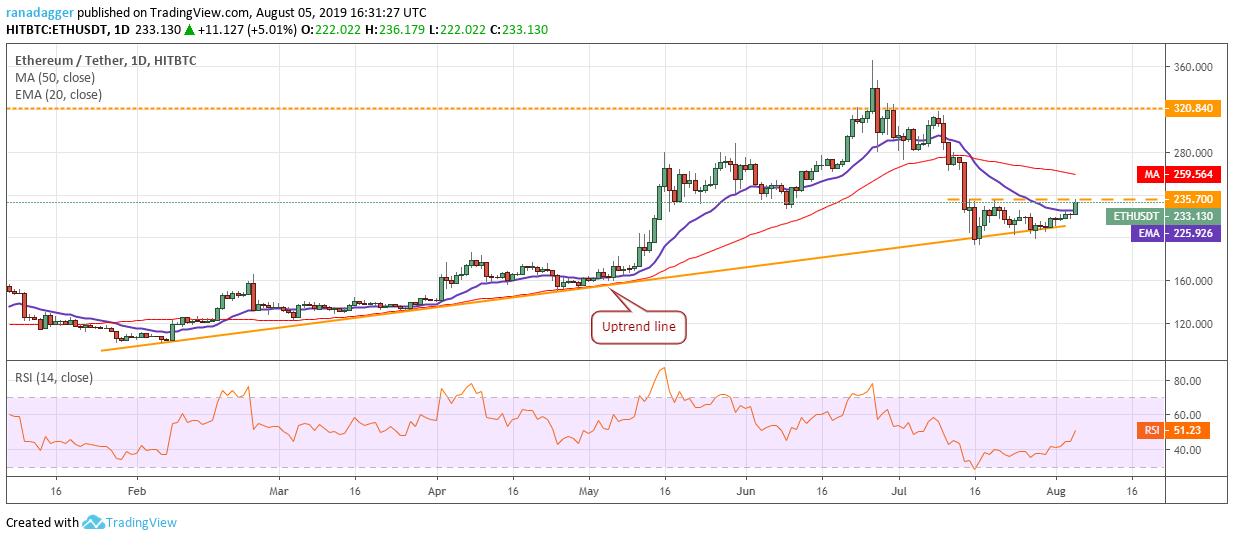
The ETH/USD pair might face some selling at the 50-day SMA, but we expect it to be crossed after a minor dip or consolidation. The flattening 20-day EMA and RSI above 50 show that selling has subsided.
Contrary to our assumption, if the price reverses direction from just above $235.7 and dives below the uptrend line, it will signal weakness. The trend will turn down if the pair drops below $192.945.
XRP/USD
XRP has cleared the first hurdle. It has broken out of the 20-day EMA and is on its way towards the 50-day SMA. It might face resistance at $0.34229, above which it is likely to pick up momentum. The 20-day EMA is flattening out and the RSI is just below 50, which suggests that the selling pressure has abated.
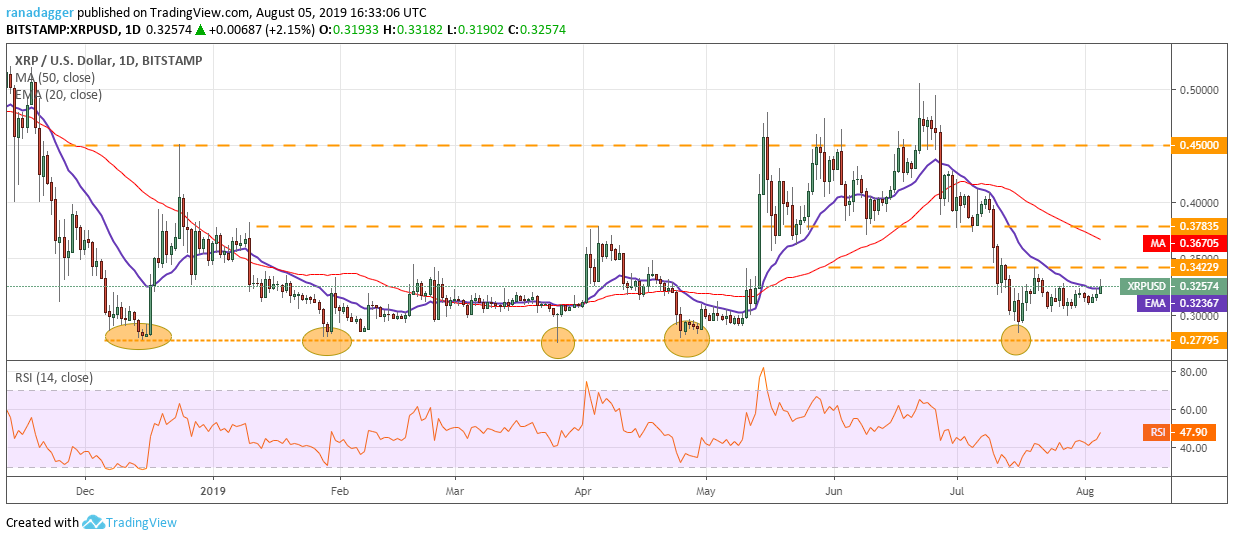
Traders can initiate long positions on a close (UTC time frame) above $0.34229 with a stop loss of $0.2750. The target objective is a move back to $0.45.
Our bullish view will be negated if the XRP/USD pair turns down either from $0.34229 or from the 50-day SMA and plummets below the critical support of $0.27795. If that happens, the downtrend will resume, which will be a huge negative.
LTC/USD
Litecoin (LTC) spurted higher following the halving, but the price is facing resistance at $105.6760. If bulls fail to scale this level, the digital currency might remain range bound for the next few days. The flattening 20-day EMA and RSI just above 50 also points to a consolidation in the near term.
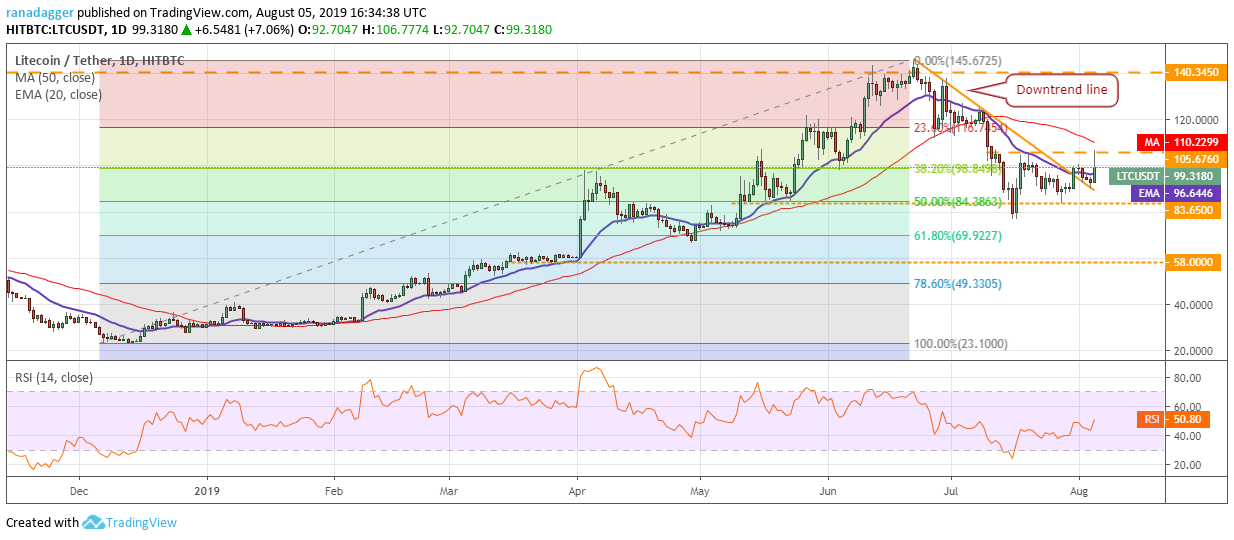
The LTC/USD pair will turn bullish if it breaks out and closes (UTC time frame) above $105.6760. There is a minor resistance at the 50-day SMA, above which the pair can move up to $120 and above it to $140.3450. Therefore, traders can buy on a close above $105.6760 and keep a stop loss of $90. The trend will turn bearish on a breakdown of $76.7143–$83.65 support zone.
BCH/USD
Bitcoin Cash (BCH) has broken out of the overhead resistance at $345.80, which completes the ascending triangle pattern. If the price closes (UTC time frame) above $345.80, traders can initiate long positions as recommended in an earlier analysis. This pattern has a target objective of $440.37, above which it can move up to $500.
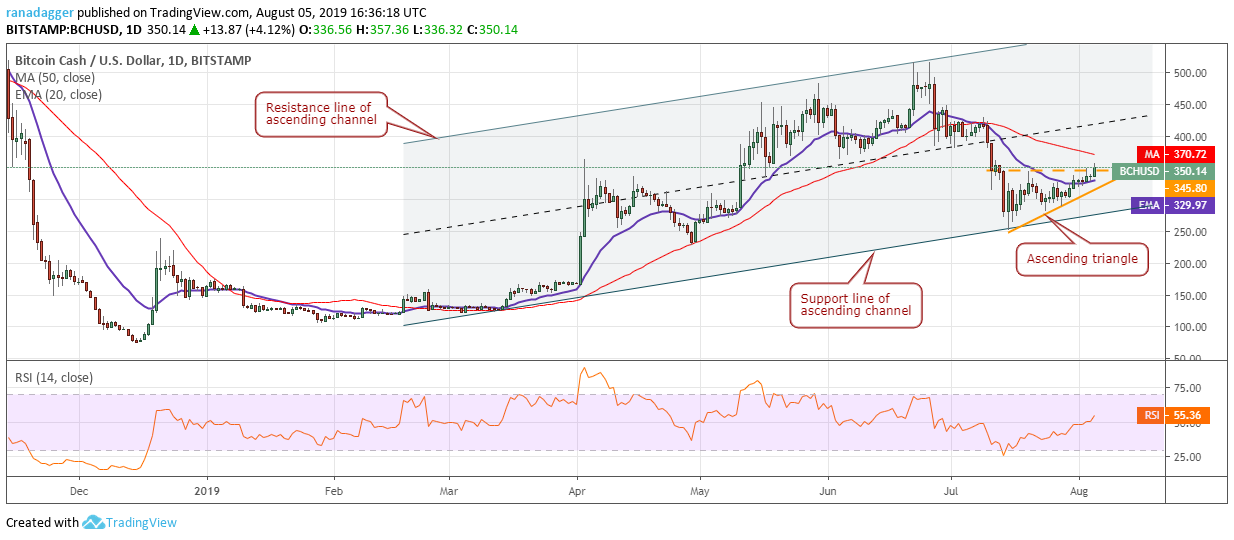
The 20-day EMA has flattened out and the RSI has climbed into positive territory, which suggests that the bulls are making a comeback.
Our bullish view will be invalidated if the BCH/USD pair reverses direction from the 50-day SMA and plunges below the support line of the ascending channel. In such a case, a drop to $227.70 is possible.
BNB/USD
Though Binance Coin (BNB) has been below the uptrend line for the past few days, bears have not been able to capitalize on it. The bulls are attempting to push the price back above the uptrend line once again. If successful, a rally to the 50-day SMA and a retest of the lifetime highs above it is likely.
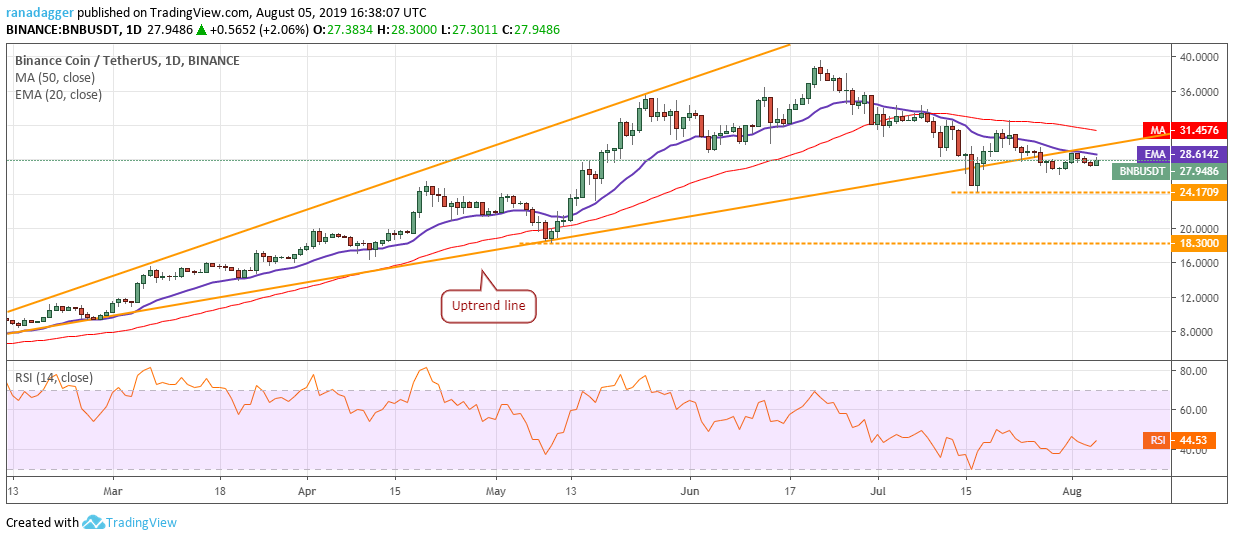
Traders can wait for the price to either break out of $32.60 or sustain above the uptrend line for three days before initiating long positions. The stop loss can be kept at $24 because if this support cracks, the BNB/USD pair can plunge to $18.30. Contrary to our assumption, if the price fails to rise above $32.60, the pair might remain range-bound for a few days.
EOS/USD
EOS has bounced off the uptrend line, which is a positive sign. If the price sustains above the 20-day EMA, it will move up to $4.8719. A breakout and close (UTC time frame) of this level will complete an ascending triangle pattern. Though the 50-day SMA is just above it, we expect it to be crossed. The target objective is $6.4438 and above it $7.60.
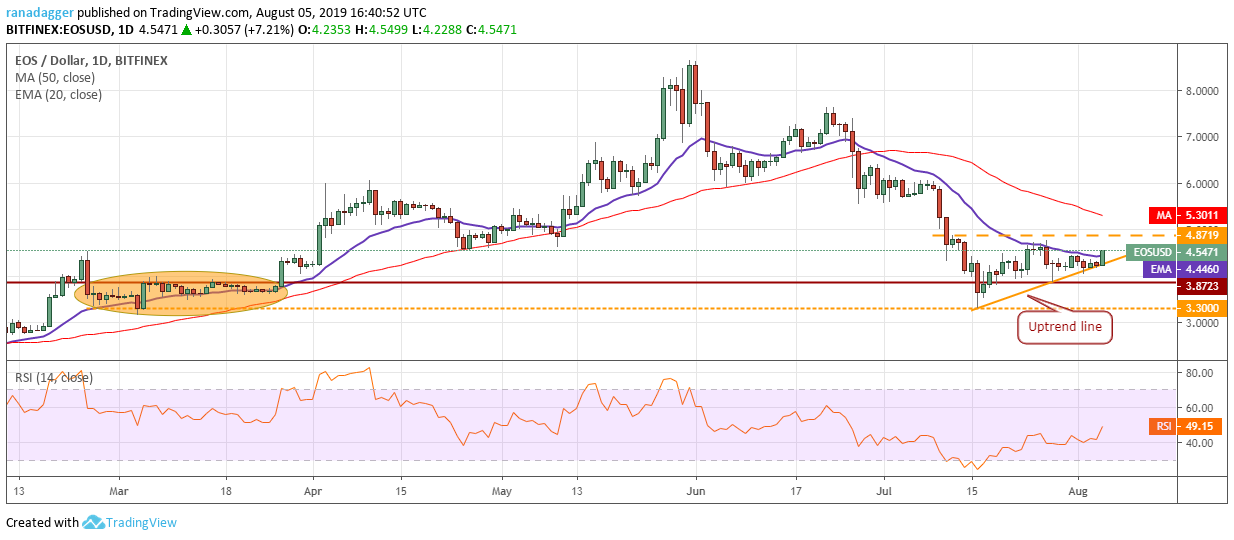
Traders can buy on a breakout and close (UTC time frame) above $4.8719 and keep a stop loss of $4. We will raise the stop loss at the first available opportunity. The 20-day EMA is flattening out and the RSI has risen close to the midpoint, which suggests that bears are losing their grip. The bears will make a comeback if they defend the overhead resistance and sink the EOS/USD pair below the uptrend line and the critical support zone of $3.8723–$3.
BSV/USD
Bitcoin SV (BSV) is gradually moving higher. It has reached the resistance line of the descending channel. If the price breaks out of the channel, it will indicate a change in trend. The first target is a move to $188.690 and above it a retest of lifetime highs.
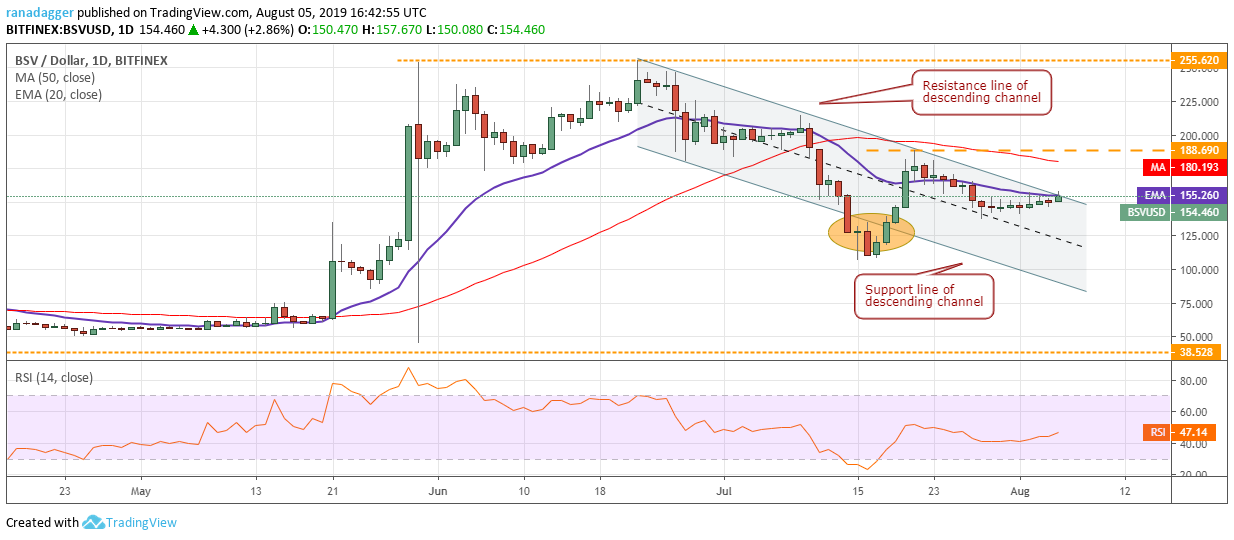
However, the 20-day EMA is flattening out and the RSI is just below the midpoint, which points to a possible consolidation in the near term. The BSV/USD pair might remain stuck between $188.690 and $136.890 for a few days. As sentiment has turned bullish, aggressive traders can buy on a close (UTC time frame) above the channel and keep a stop loss of $136.
Our view will be invalidated if the price fails to sustain above the channel and plummets below $136.890. Below this level, a drop to $107 is probable.
XLM/USD
While most major cryptocurrencies are participating in the recovery, Stellar (XLM) has hardly moved. This shows a lack of interest among both buyers and sellers. After this period of relative quiet, volatility will expand.
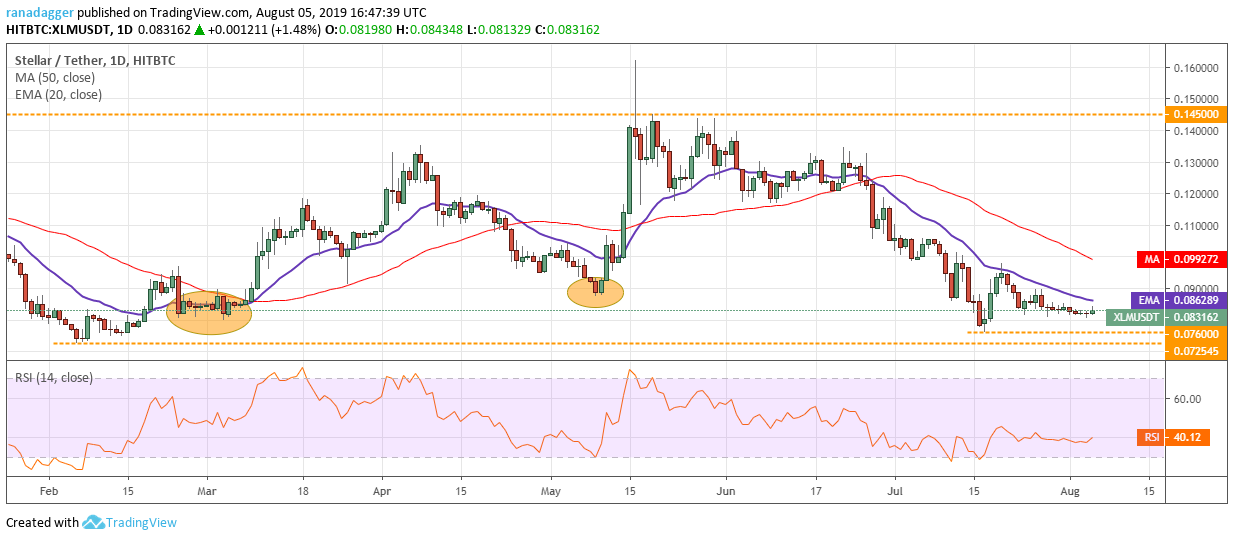
If volatility expands to the upside and the XLM/USD pair scales above the 20-day EMA, it can move up to the 50-day SMA. We expect the pair to pick up momentum above $0.10 and start its journey towards $0.145. Therefore, traders can buy on a close (UTC time frame) above $0.10 and keep a stop loss of $0.071.
Contrary to our assumption, if volatility expands to the downside, the pair can drop to $0.076 and below it to $0.072545.
XMR/USD
Monero (XMR) has risen to the tenth spot in terms of market capitalization, hence, it has been included in today’s analysis. The correction stalled just above the 61.8% Fibonacci retracement level of the recent rally. The bulls have resumed the up-move and pushed the price back above both moving averages, which is a positive sign.
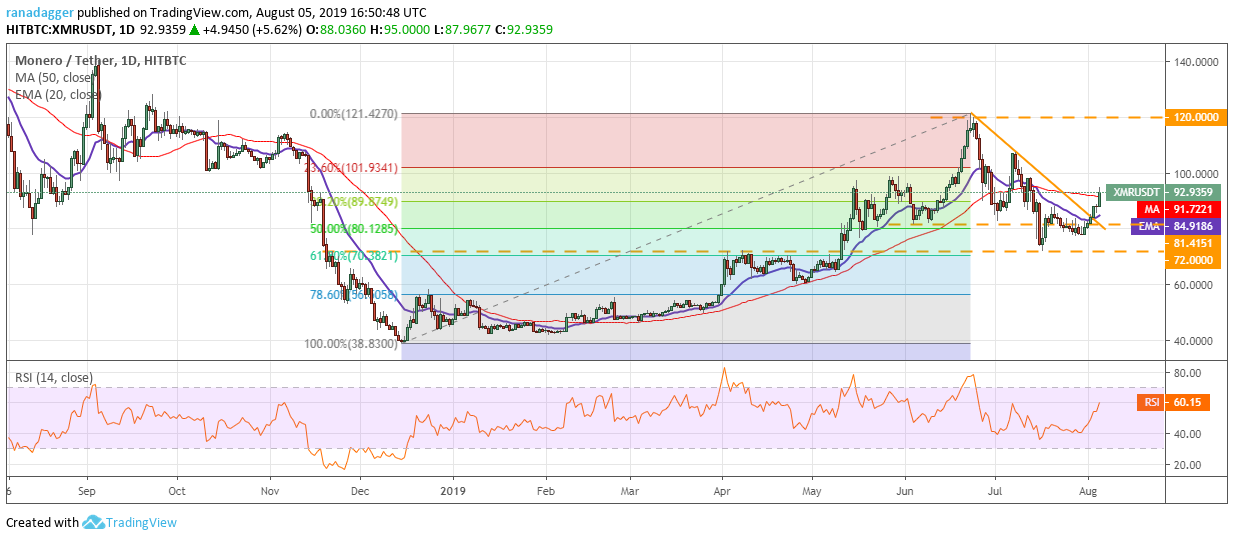
The 20-day EMA has started to slope up and the RSI has jumped into positive territory. This shows that bulls have the upper hand in the short-term. The price can now move up to $107, above which a rally to $120 is possible. Traders can buy at the current levels and keep the stop loss at $71. If the price fails to scale above $107, we might suggest booking partial profits and raising the stops to breakeven. On the downside, support exists at the 20-day EMA and below it at $72. A break below this level will indicate weakness.
Market data is provided by the HitBTC exchange.


Comments (No)