Though fundamentals play a large part in determining the price of an asset, short-term movements of the markets are driven by sentiment. This was clearly visible during the week.
A few events soured sentiment early in the week, which dragged the total market capitalization of the crypto space down to $202 billion. When the markets are in a corrective phase, traders can become bearish even on events that do not have a material impact on the short-term.
After the initial knee-jerk reaction, the markets digested the news and realized that it was not materially negative. This resulted in a pullback, which forced the aggressive bears who had gone short to cover their positions in a hurry. This propelled the total market cap to just over $262 billion on Oct. 26, a rise of about 30% within three days.
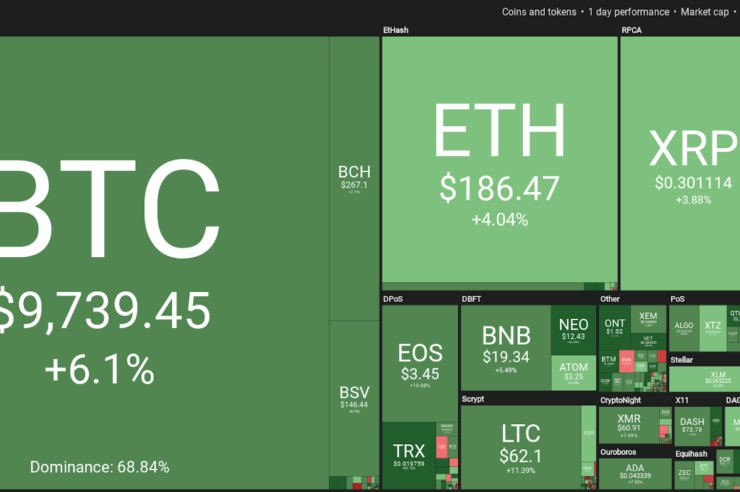
Cryptocurrency weekly performance. Source: Coin360
The events of the week are important as they show that the sentiment has changed from sell on rallies to buy the dips. Unlike the bear market of 2018, the bulls are not panicking at lower levels but are using dips to accumulate. If the cryptocurrencies hold their recent gains after a shallow pullback, a strong year-rally is likely. Let’s see, if any of the top performers are showing signs of a new uptrend.
NEO/USD
NEO had a massive run in the past seven days and it turned out to be the best performer among major cryptocurrencies. After this rise, will it succumb to profit-booking and turn down or can it start a new up move? Let’s analyze its chart.

The NEO/USD pair has been range-bound between $20.96333 and $5.58 for about a year. For the past three weeks, the price had formed a very tight range, which showed that the bulls and the bears were in a state of equilibrium.
The tight range resolved to the upside with a strong surge. This means that the bulls had been accumulating near the lows. The altcoin is trading near its weekly highs, which shows that the bulls are in no hurry to encash their profits as they expect the rally to continue.
The next level to watch on the upside is $14 and above it $20.96333. The traders can wait for a dip during the week and buy closer to $8.5 with a stop loss of $5.50.
BSV/USD
Bitcoin SV (BSV) was the second-best performer of the past seven days. It closely followed the leader with a rally of about 55%. After this massive rally, is this a good time to buy or should traders wait for it to correct to enter fresh positions?

The BSV/USD pair rallied sharply after breaking out of the overhead resistance at $107. The momentum was strong enough for it to break out of the second resistance at $138.950 and reach a high of $154.99 during the week.
After the sharp rally, the short-term traders might book profits that could result in a pullback to $126.189, which is 38.2% Fibonacci retracement level of the most recent rally. Below this level, the next support is at the 50% retracement level of $117.293. We anticipate the pair to turnaround from one of the above-mentioned levels. Instead of chasing the price higher, we suggest traders wait for a dip to buy as that will offer a good risk to reward ratio.
Contrary to our assumption, if the momentum continues, the pair can move up to $188.69. This level might act as a resistance, but if this is also crossed, a retest of the highs will be on the cards.
BCH/USD
Bitcoin Cash (BCH) shrugged the news of an unknown miner controlling more than 50% of the hash rate for 24 hours and turned out as the third-best performer of the past seven days. This shows that the sentiment has turned bullish but can the altcoin continue higher? Let’s study the chart.

The failure of the bears to break below the $203.36 support and extend the decline, even after breaking down of a head and shoulders pattern is a positive sign. The BCH/USD pair had been trading in a tight range for the past three weeks. Once the bulls broke above this range, the pair picked up momentum and rallied to the neckline of the head and shoulders pattern. This level might act as a resistance for some time.
A dip from the neckline is likely to find support at $241.85. If the pair bounces off this support, the bulls will make another attempt to scale above the neckline. If successful, a move to $360 is possible. The pair will pick up momentum on a close above $360.
Our bullish view will be invalidated if the price slips below $241.85. That will indicate a lack of buyers at higher levels. A break below $203.36 will resume the downtrend.
BTC/USD
Bitcoin (BTC) had a roller-coaster ride in the past week. It dipped below the critical support of $7,702.87 on Oct. 23. Analysts anticipated that opposition to Facebook’s project indicated that the adoption of cryptocurrencies into the mainstream is likely to be delayed. Another negative news that might have worried some was Google’s quantum computer. However, this set of news could not keep the price down for long.
The leading cryptocurrency reversed direction sharply on Oct. 24 and skyrocketed higher. Interestingly, as the prices soared, Bitcoin futures volume on Bakkt spiked, which shows that institutional traders will jump in if Bitcoin starts a sustained up move.
Bakkt announced that option contracts for Bitcoin will start trading from Dec. 9. This will add one more product for the institutional traders. Does the recent rally confirm that a bottom is in place and should the traders buy now or wait for lower levels to enter?

The BTC/USD pair has formed an outside day candlestick pattern on the weekly chart. If we see follow-through buying after a shallow pullback, this might act as a reversal pattern. On the downside, the pair took support close to $7,337.78, which is 61.80% Fibonacci retracement level of the recent rally. The rally hit a roadblock just above the downtrend line.
The body of the candlestick pattern of the past week is small, with large wicks on either side. This shows that the market participants have rejected both lower and higher levels. Both the moving averages are flat and the RSI is just above the midpoint, which suggests a consolidation for a few weeks.
This range-bound action should be viewed as a buying opportunity and the traders can initiate long positions on dips, with a stop loss of $7,200. If the bulls scale and sustain above the downtrend line, a rally to $13,973.50 will be on the cards.
Our view will be invalidated if the price turns down from the current levels and breaks down of $7,297.21 but we give it a low probability of occurring.
LINK/USD
Decentralized Finance (DeFi) applications can connect to Binance data using Chainlink (LINK) oracles. Binance CEO Changpeng Zhao said that this can accelerate the growth of DeFi. Let’s see what does its technicals project.

The LINK/USD pair broke above the overhead resistance of $2.8498 once again but the bulls have not been able to sustain above it. This shows that the bears are defending the resistance level. However, the bears have not been able to sink the pair back below the critical support of $2.0531. This is a positive sign as it shows buying on dips.
The 20-week EMA is sloping up and the RSI is in the positive territory, which suggests that the bulls have the upper hand. The bulls are likely to make another attempt to scale above $2.8498 in the next few weeks. If successful, a rally to the lifetime highs of $4.5826 is possible.
Contrary to our assumption, if the pair turns down from the current levels, it will remain range-bound between $2.8498 and $2.0531 for a few weeks. The trend will weaken if the bears break below the support at $2.0531.
The views and opinions expressed here are solely those of the author and do not necessarily reflect the views of Cointelegraph. Every investment and trading move involves risk, you should conduct your own research when making a decision.
The market data is provided by the HitBTC exchange.


, NEO, BSV, BCH, LINK)
, NEO, BSV, BCH, LINK)
Comments (No)