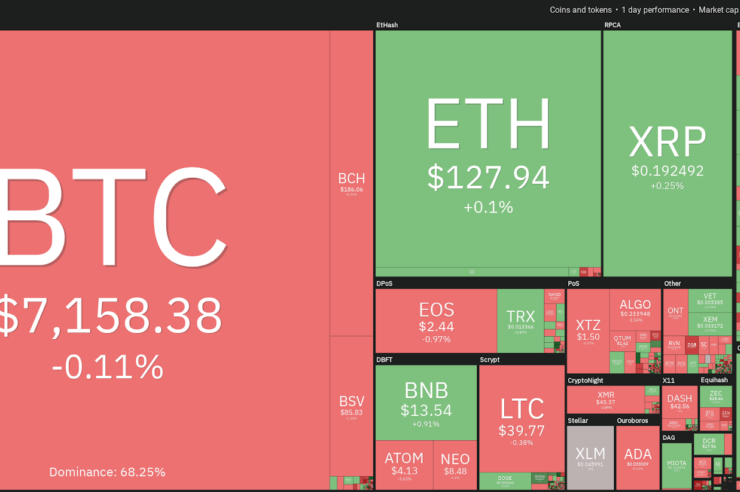
Altcoins dropped severely during the recent retracement of Bitcoin (BTC) price to $6,400, which increased Bitcoin’s dominance above 70%. One of these coins is XRP, which took a hit of 20% and is currently valued at $0.19 per coin — or the lowest value in over two years — after hitting as low as $0.178.
Crypto market daily performance. Source: Coin360
Nevertheless, the blockchain payments firm behind XRP, Ripple, just announced that it raised another $200 million in funding. Aside from that, they claimed to have ”the strongest year of growth to date in 2019.”
But the question for XRP now is whether the current lows provide a perfect investment opportunity, or will the top-3 altcoin continue to lose ground? Let’s take a look at the charts to spot the trend.
XRP hits lowest USD value in 26 months
Unfortunately for XRP holders, the trend remains the same since the last article: still trending downwards, posting lower lows and lower highs.
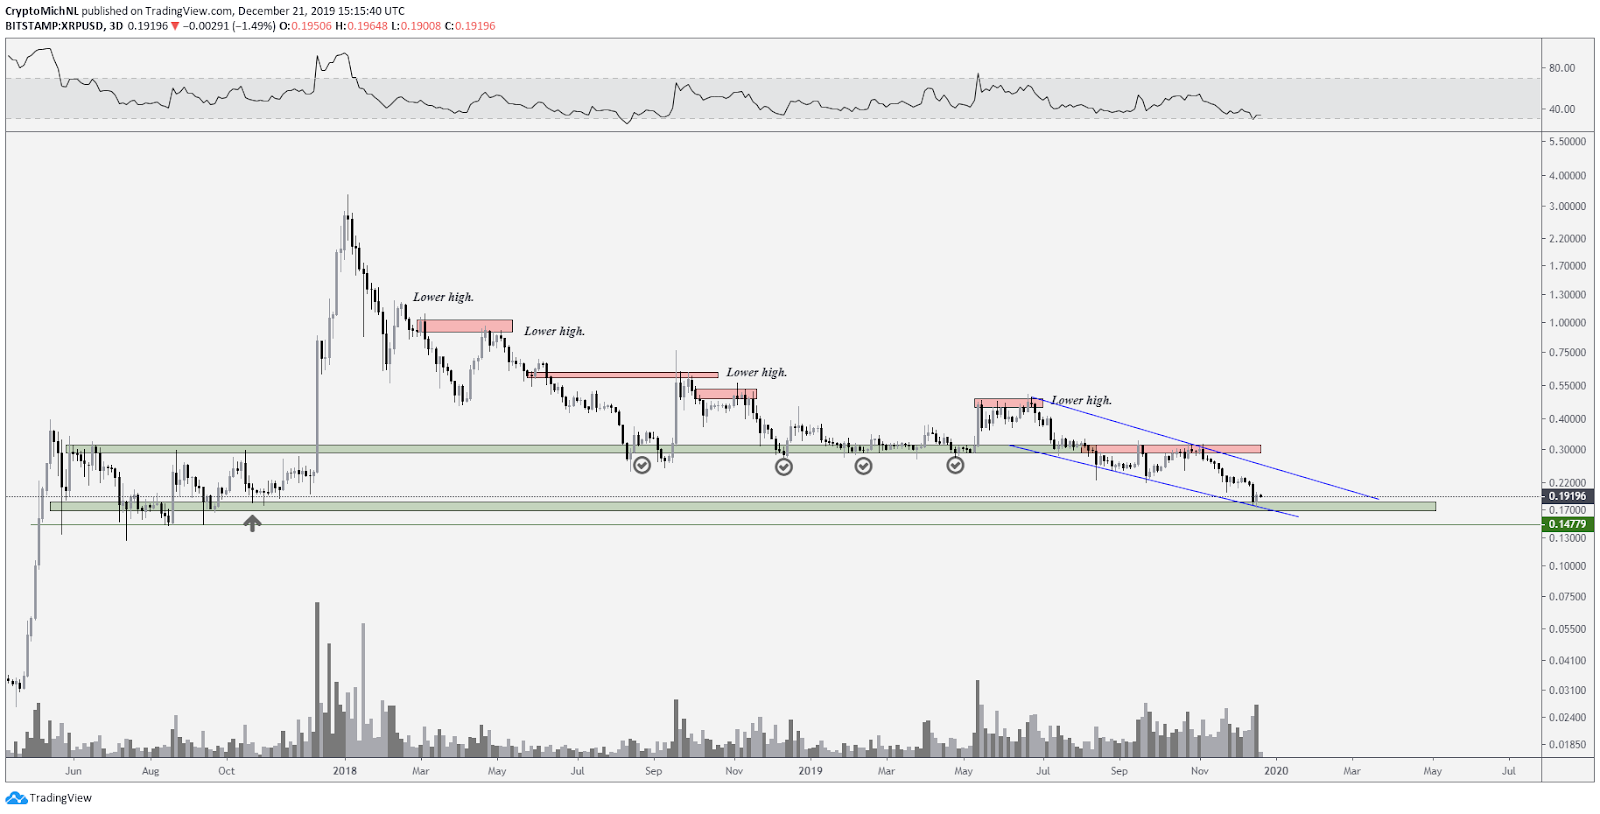
XRP USD 3-day chart. Source: TradingView
As XRP made a bearish retest of the $0.30 level, the price retraced further and is currently resting on the next significant support around $0.17-0.20. This is the lowest level since October 2017 and is also a full retrace of the massive move during peak mania in early 2018 with a high of around $3.
Now, the sentiment is hitting euphoria levels for bears as people can’t see any bullish perspectives for the coin anymore.
But does this mean that XRP is a great opportunity right now? No. However, maximum investment opportunity typically occurs when prices are not showing the progress of the asset or project itself yet; and this just may be the case with XRP.
Fractals start to line up
Markets move in similar ways, mostly based on human emotions and market psychology. That’s why it’s interesting to look at fractals and earlier cycles. Similarly, the bubble of 2017 in Bitcoin and the “dot com bubble” are comparable in their pattern itself.
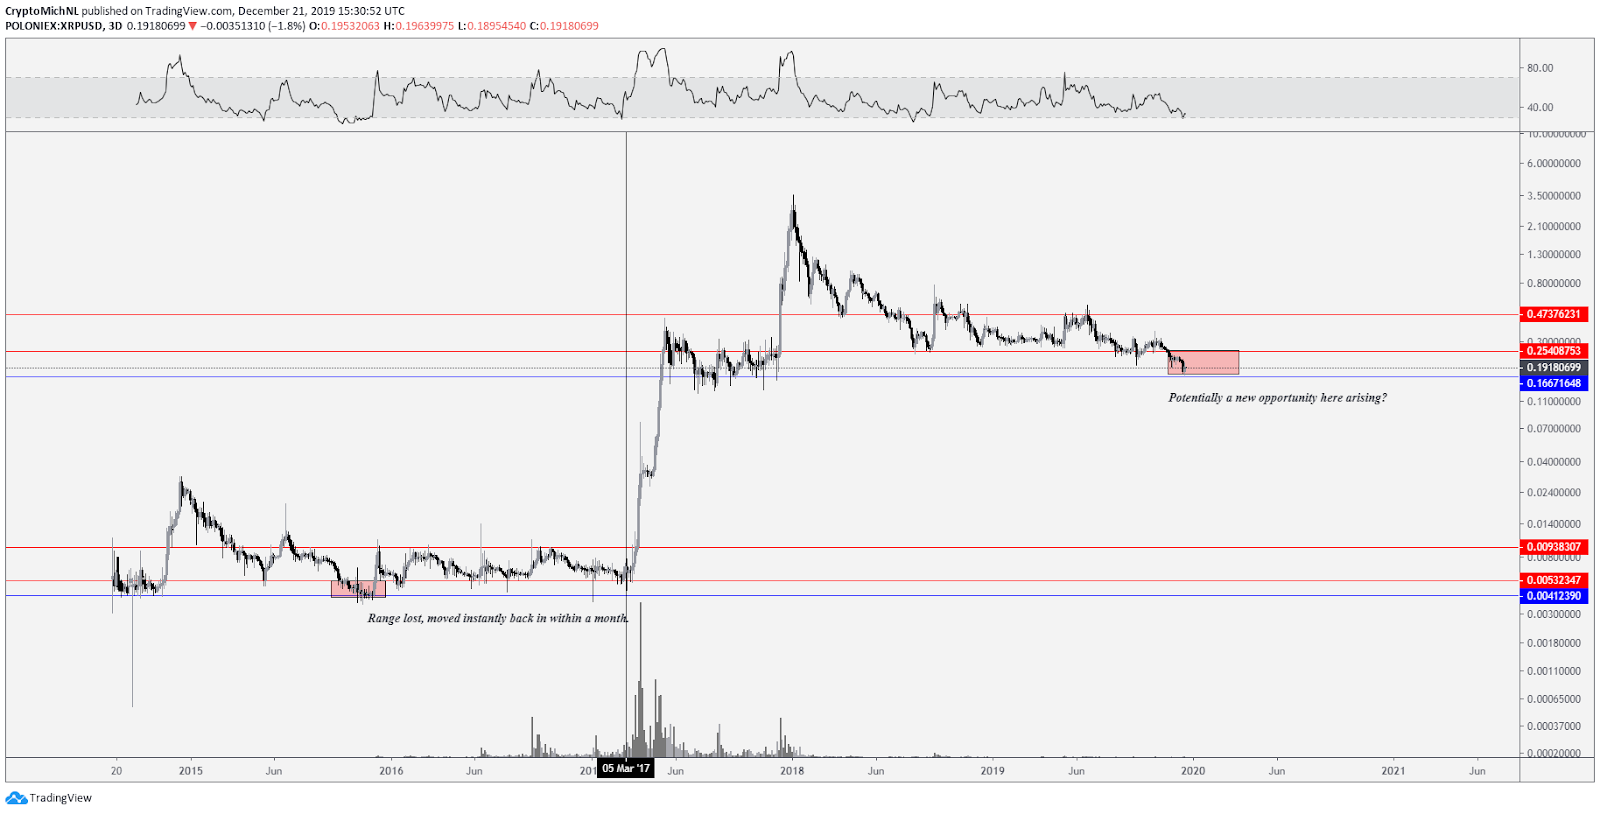
XRP USD 3-day chart. Source: TradingView
Checking the complete graph of XRP, the chart is divided into two periods. One through 2015-2016, and the other one since the big jump in 2017.
In the first period, the price moved between two significant levels for almost two years, between $0.005 and $0.009. There has only been one moment when the price moved below this range in December 2015/January 2016.
If we analyze that in relation to where Bitcoin was at this point, we can see that the given drop coincided with Bitcoin finding its bottom from the first parabolic move.
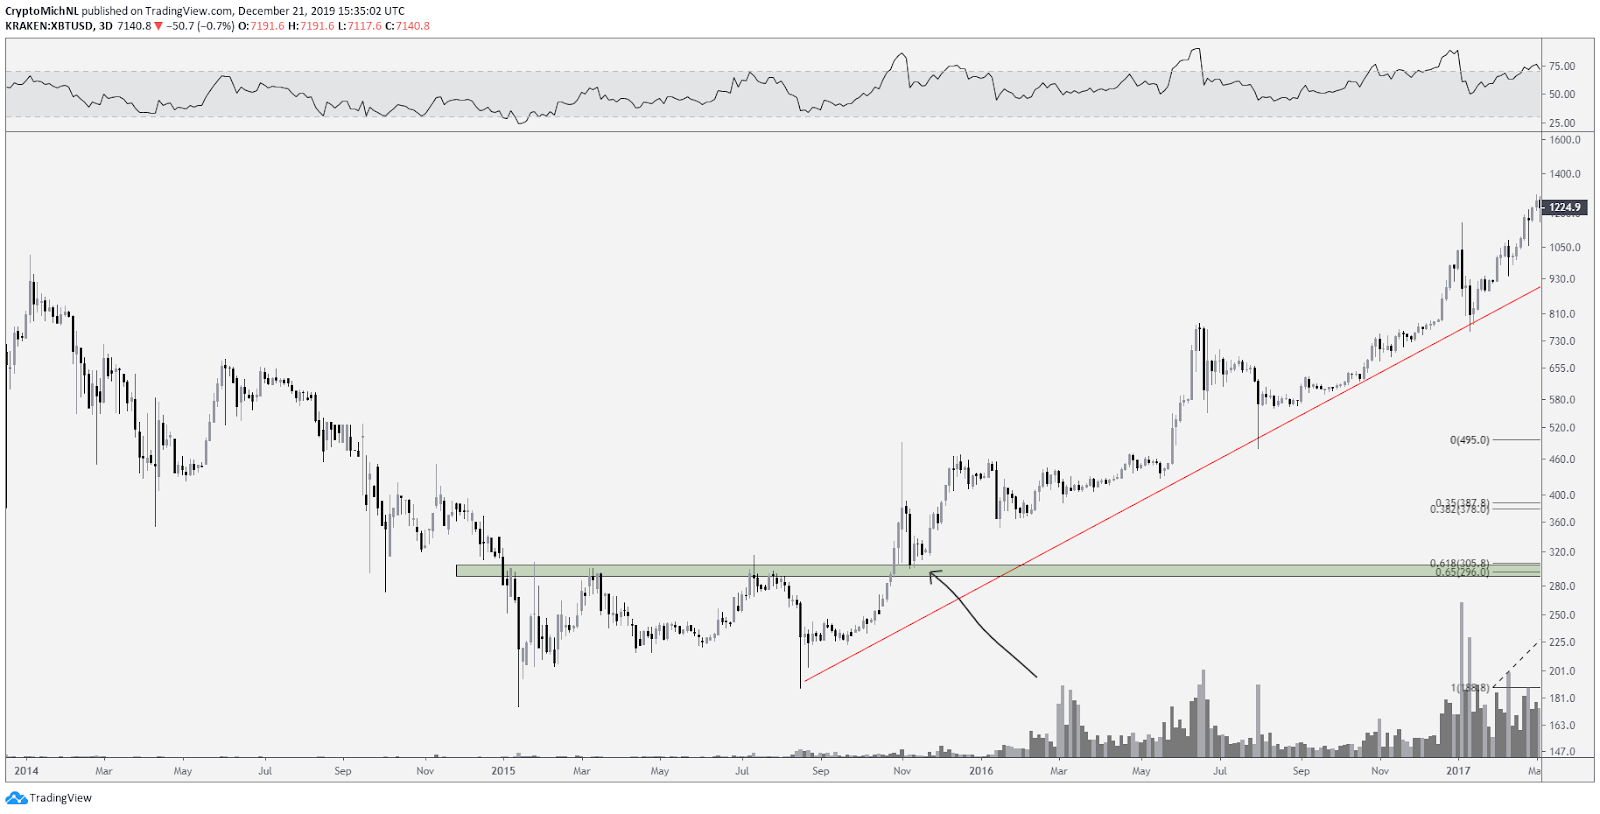
BTC USD 3-day chart. Source: TradingView
Interestingly enough, the price of XRP has been hovering in a similar range for more than a year before it broke south. This breakdown is leading to a test of the next support level (the blue horizontal line, similar to the one in the previous cycle), which could suggest that XRP itself is nearing its cyclic bottom.
Moreover, if you compare the recent movements of BTC with XRP, Bitcoin is now potentially bottoming once more from its first parabolic move (and possibly out of the bear market).
However, one should not assume that the current period is just like 2017 — the same level of euphoria just isn’t there. There’s also not nearly the same amount of new retail traders entering the market right now.
Today, it’s mostly the left-over people from 2017 and early adopters that are sticking around — similar to the period at the beginning of 2016. Thus, it would make more sense to compare fractals with 2016 rather than 2017.
XRP retracing back to the bottom of BTC pair
The XRP/BTC pair, in particular, is not showing much strength after losing major support. This level broke due to the volatility of Bitcoin but it was critical nonetheless for XRP. Then a retracement happened to the next support zone, which must now hold if XRP wants to prevent itself from making new lows.
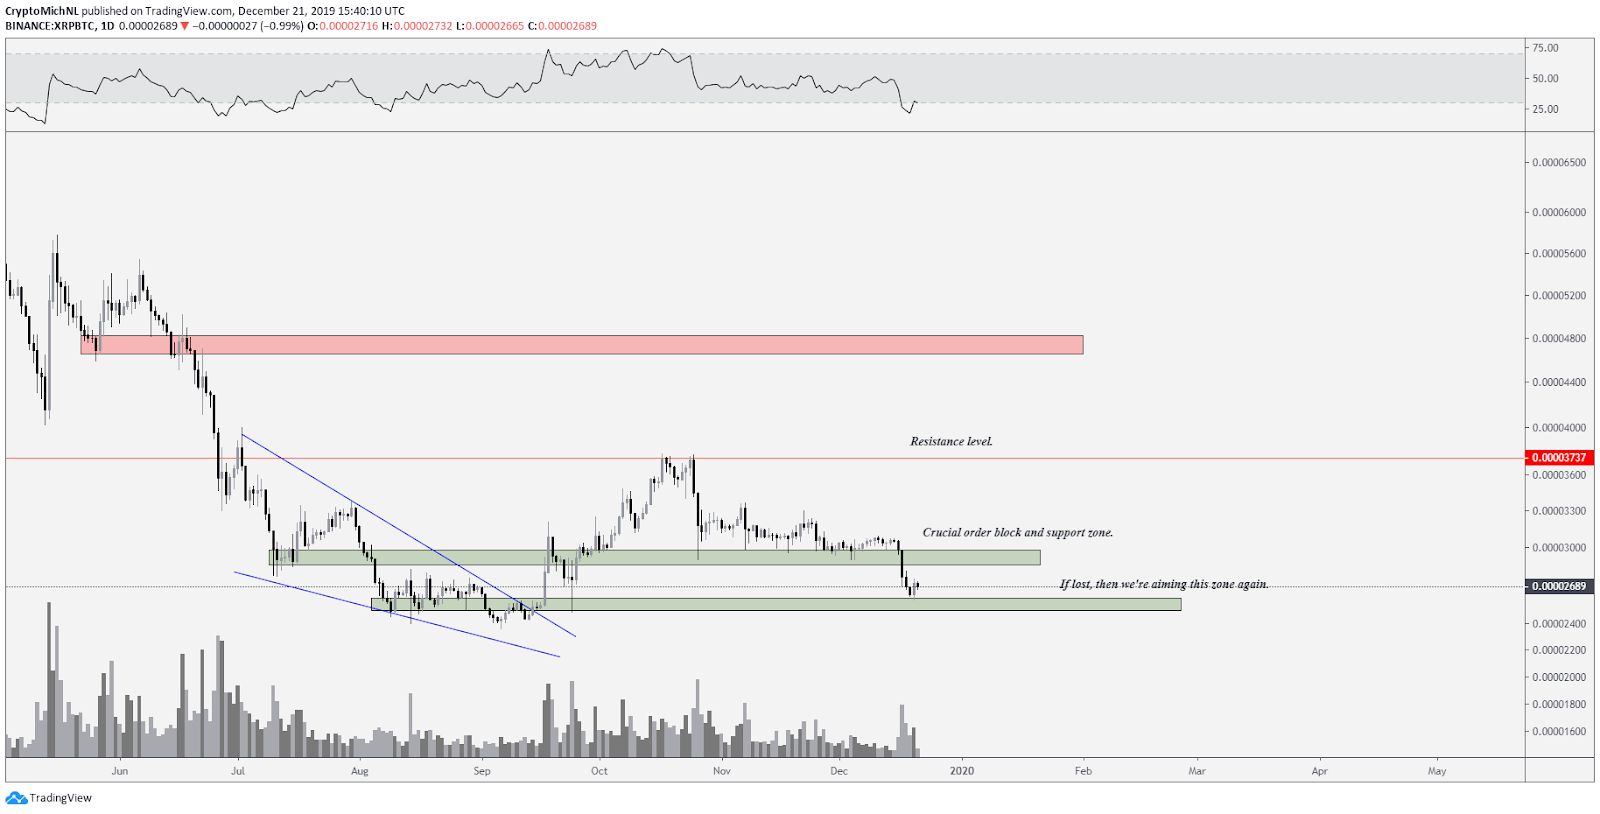
XRP BTC 1-day chart. Source: TradingView
Based on the overall XRP/BTC chart, a conclusion can be drawn that XRP is still showing significant bullish divergences on higher time frames for a potential trend reversal. However, one caveat is that the green zone must hold to justify these bullish divergences.
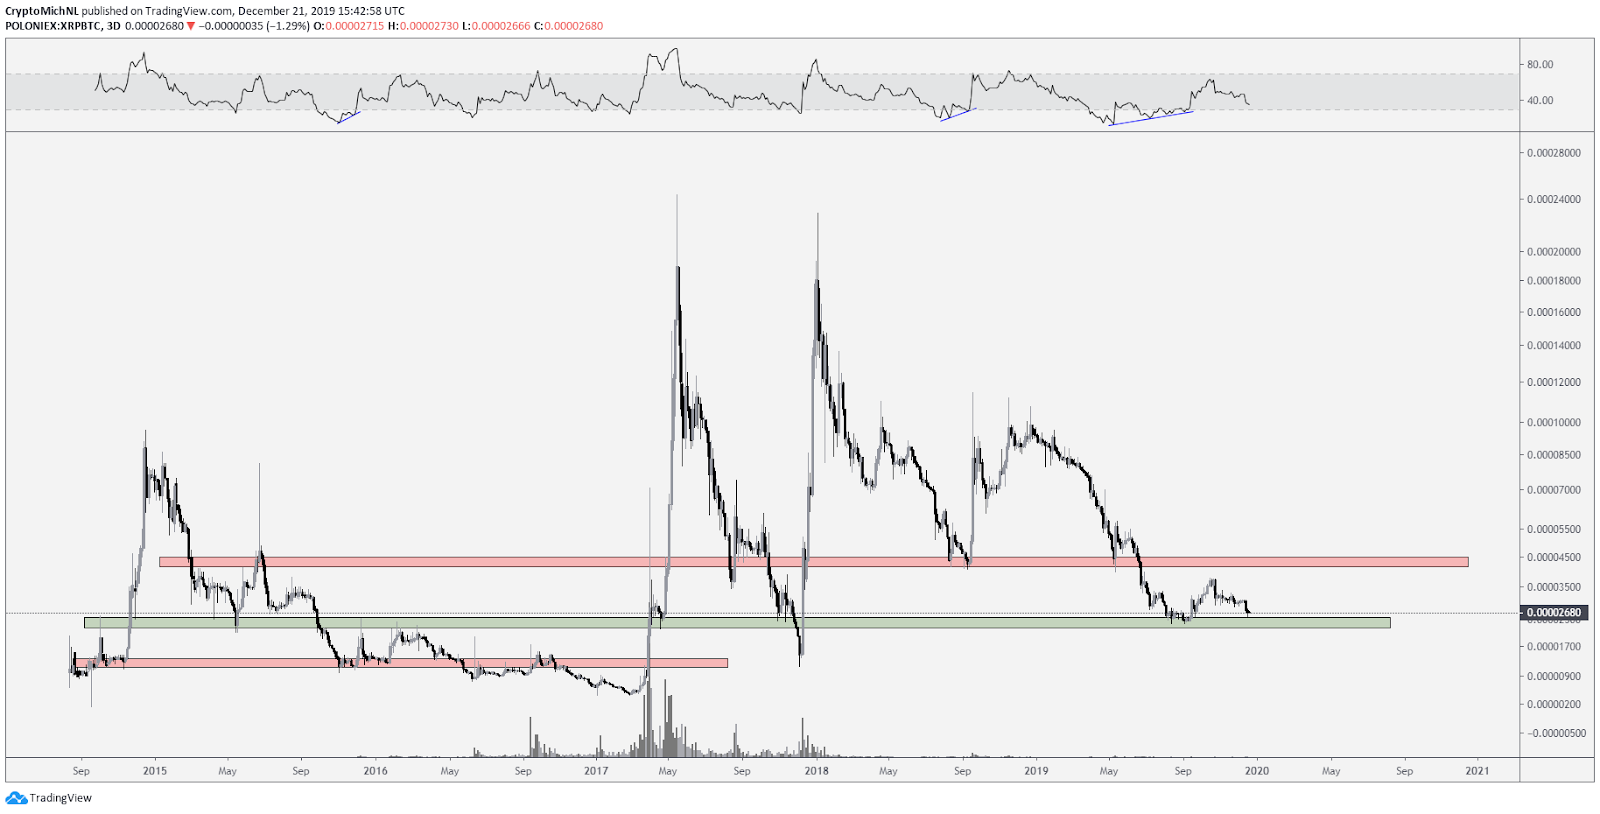
XRP BTC 3-day chart. Source: TradingView
As the chart shows, the green area is a zone that has served as support and resistance throughout each cycle. If this zone is unable to support price at this point, XRP is likely to move down towards the next red zone area around 1,200-1,300 satoshis.
Additionally, a more preferable move would be setting a slightly higher low in this zone for a potential uptrend and continuation of the bullish divergences.
Looking forward
Holding XRP in the past few years didn’t bring the return people were looking for as the price retraced 94.80% since the peak in January 2018.
So does this mean that shorting XRP is a wise strategy here? I don’t believe it is.
Fundamentally, the firm behind XRP is continuing to move forward and pursue their plans, as sentiment couldn’t be more bearish. Generally, the highest returns are made from investments contrary to the sentiment, which can flip quickly with just a few green candles.
However, it is crucial for XRP to hold the 2,500-2,600 (BTC) satoshi level as support and seek to find bullish divergences or support at $0.19-0.20. If this level holds as support, the risk/reward potential for longing XRP will be much higher than shorting it.
The views and opinions expressed here are solely those of the author and do not necessarily reflect the views of Cointelegraph. Every investment and trading move involves risk. You should conduct your own research when making a decision.



Comments (No)