The most recent Bitcoin price drop caused many altcoins to drop heavily, but can one say that they are doing poorly or is it only their USD pairs which are affected? Since a temporary bottom was found at the start of September, altcoins have steadily gained value in their BTC pairings. Take the following, for example: ETH/BTC is up +32%, XRP/BTC +27% and XLM/BTC has gained +29% during this time.
Let’s take a closer look at the altcoin market to investigate what is happening.
Altcoins total market capitalization chart. Source: TradingView
The altcoins market cap has been in a prolonged downturn since the beginning of July when the market reached a $126 billion cap. This same level served as a support in 2018. A harsh rejection was followed by a bearish downtrend which knocked the market cap all the way back towards the support near $60–66 billion.
Currently, the market is resting on an important order block, which was previously found to be a support and trading range back in September through November of 2017.
Based on this view, it’s clear that the market has to break upwards to become bullish again, as otherwise the downwards trend will continue.
Referencing historical data of the altcoins market price action, one can conclude that altcoins perform best when there is a slow upward move from Bitcoin. In some scenarios, altcoins even outperform Bitcoin when it’s price is slowly ascending.
Clearly, in order for altcoins to rally, Bitcoin first has to find support. That’s the key marker that is needed for altcoins to start moving alongside BTC.
Bearish retest or accumulation?
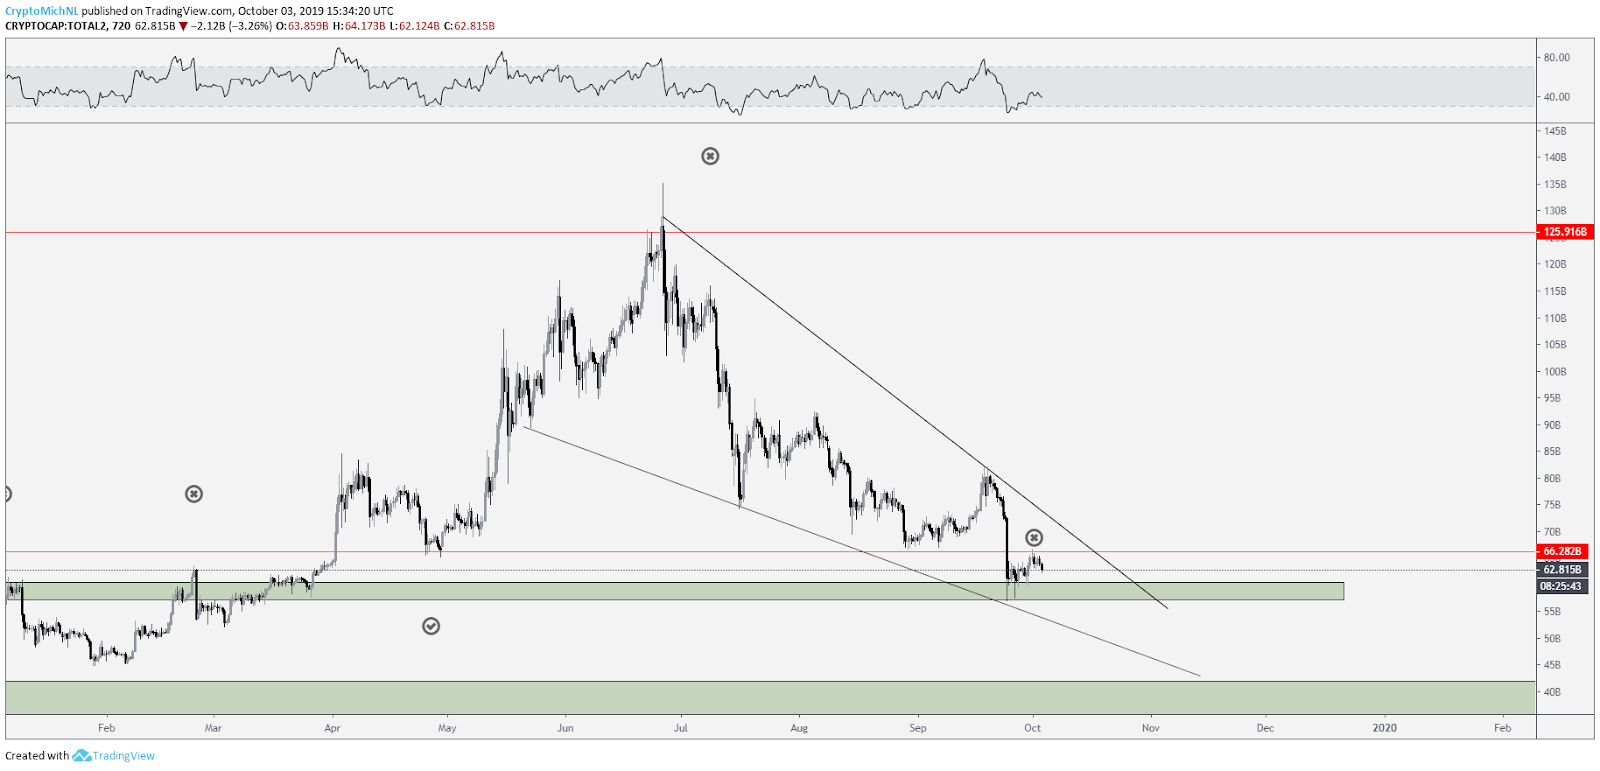
Total altcoins market capitalization 6-hour chart. Source: TradingView
If we zoom in, the chart above shows a bearish retest of the $66 billion level. In order for this scenario to turn bullish, the altcoins market capitalization has to break above the $66 billion level and reclaim is as a support.
It’s likely that the altcoins market cap will continue in this range and $57–59 billion has to remain a support in order to have some upwards perspectives. Lose this zone and the $35–$40 billion range is the next area to look for.
However, as long as the $57–$59 billion area holds as a support and the market cap moves inside the developing falling wedge structure, we could see a few slight signs of a short term reversal.
Some signs to look for in this potential bottoming scenario are bullish divergences or accumulation movements (marked by sideways patterns in a tight range).
Confirmation of these movements should follow later this month as the pattern and trend lines are coming together in preparation for a decisive move.
Ethereum 2.0 FOMO to come?
Historical data shows that Ethereum is often the main indicator for altcoins movement. This is partially because of its market cap size and the fact that the majority of the smaller coins are ERC-20 tokens built on the Ethereum platform.
Alongside this key indicator, Ethereum is working toward the release of Ethereum 2.0 which is expected to launch in Q4 of 2019. This could be a gamechanger for altcoins and a possible trigger for the market to move upwards. Price typically runs up prior to the event, so it’s possible that traders will buy the rumor and sell the news.
A bullish breakout awaits Ether
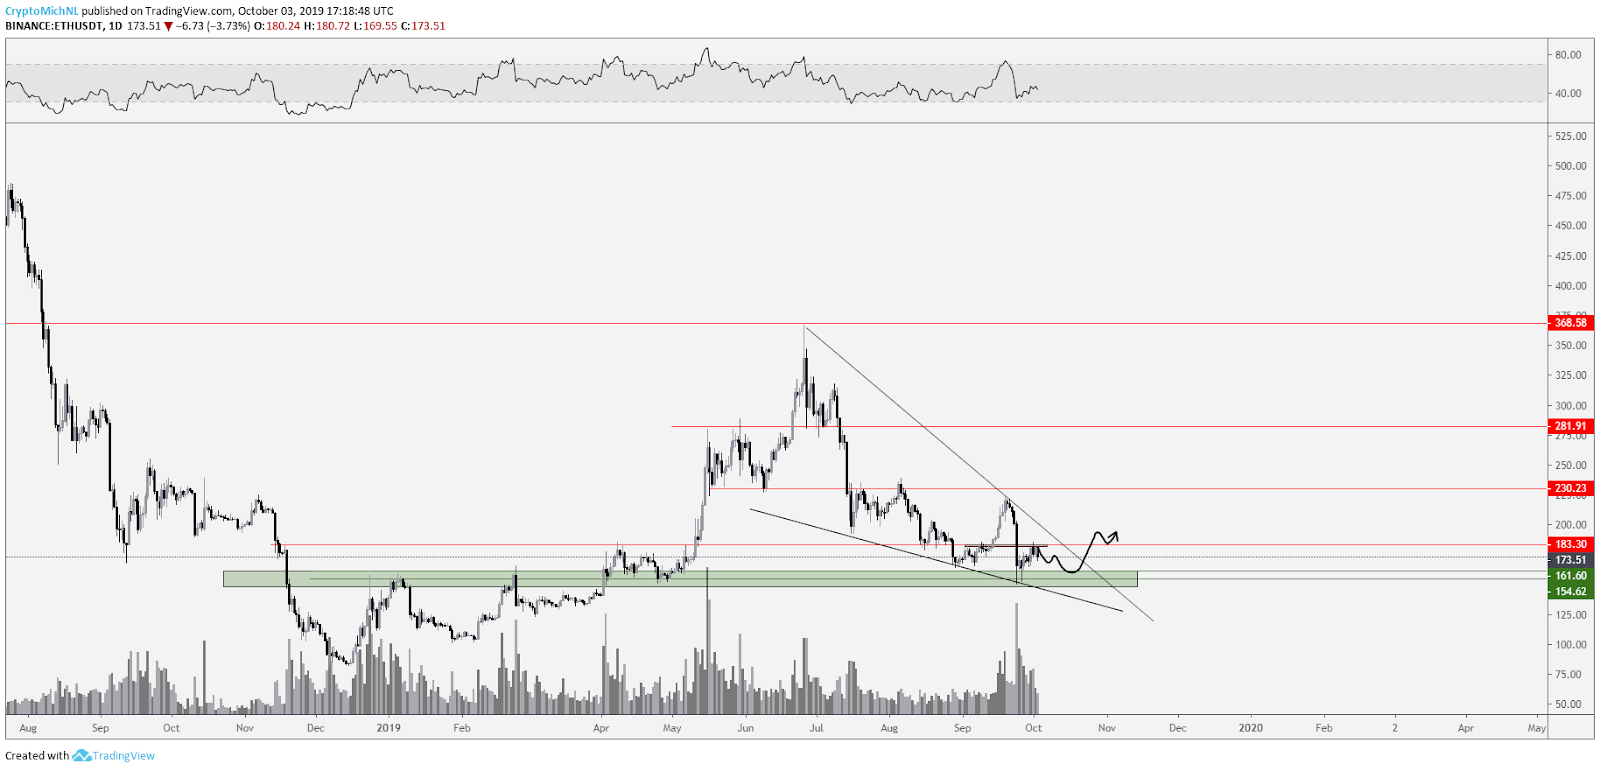
ETH/USD daily chart. Source: TradingView
Notice that the ETH/USD chart shares some similarities with the total altcoins market capitalization chart.
Ether is also hovering inside a falling wedge structure that has been in a downtrend since peaking at $368 toward the end of June. The price bounced on an important support at $155–$160 which was previously a resistance in early 2019.
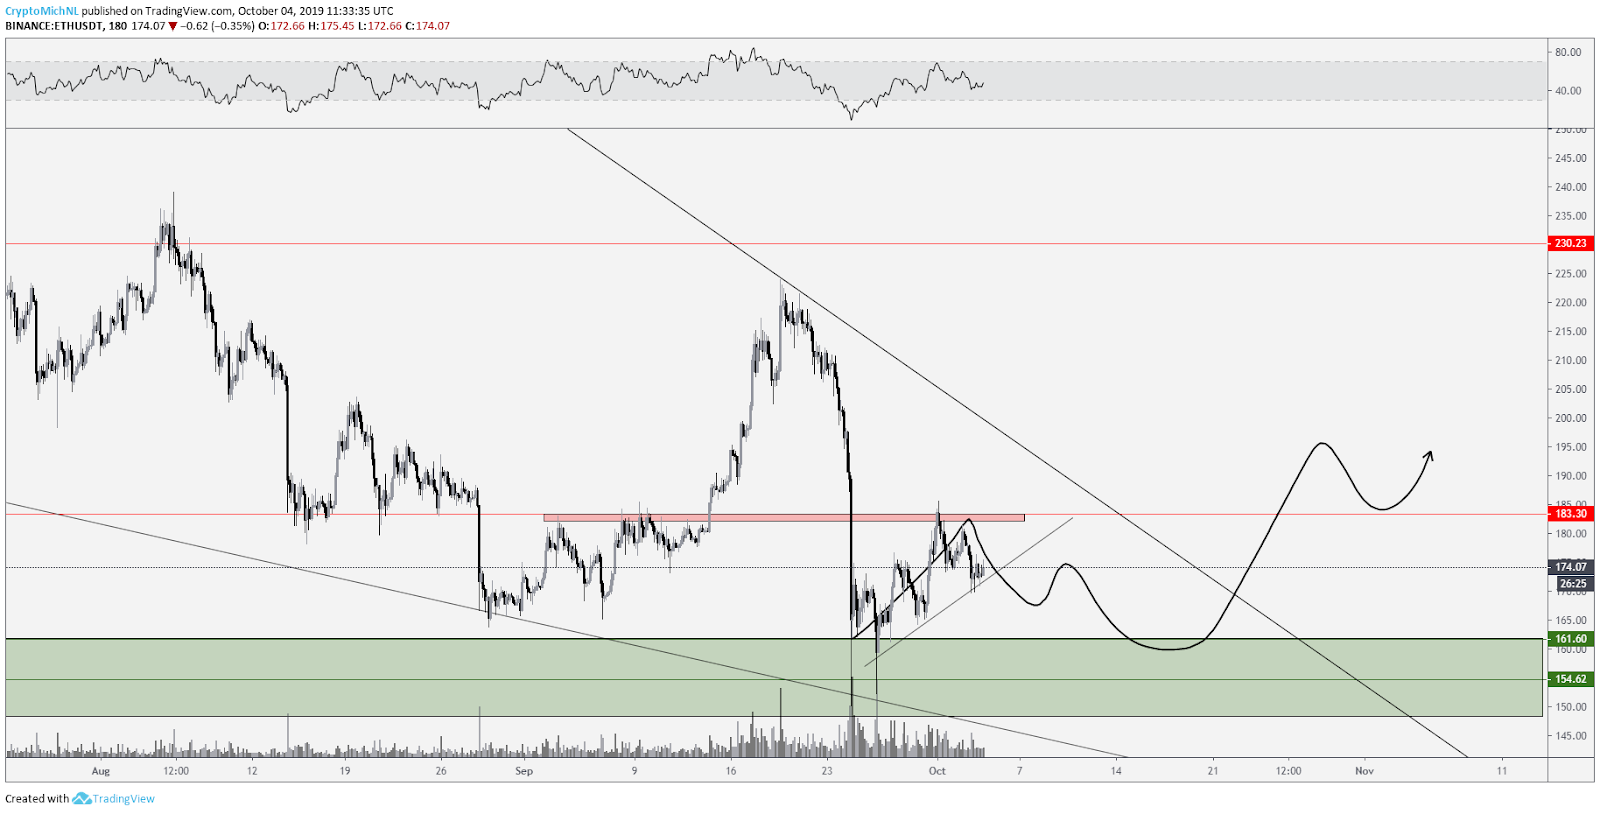
ETH/USD 4-hour chart. Source: TradingView
On the shorter time frame, a bearish retest of $183 occurred, which led the price to range a little bit more. As long as the Ether price holds the $155–$160 area as support, a major support/resistance flip could occur and some upwards price movements are ready to take place.
Will Ether follow previous market cycles?
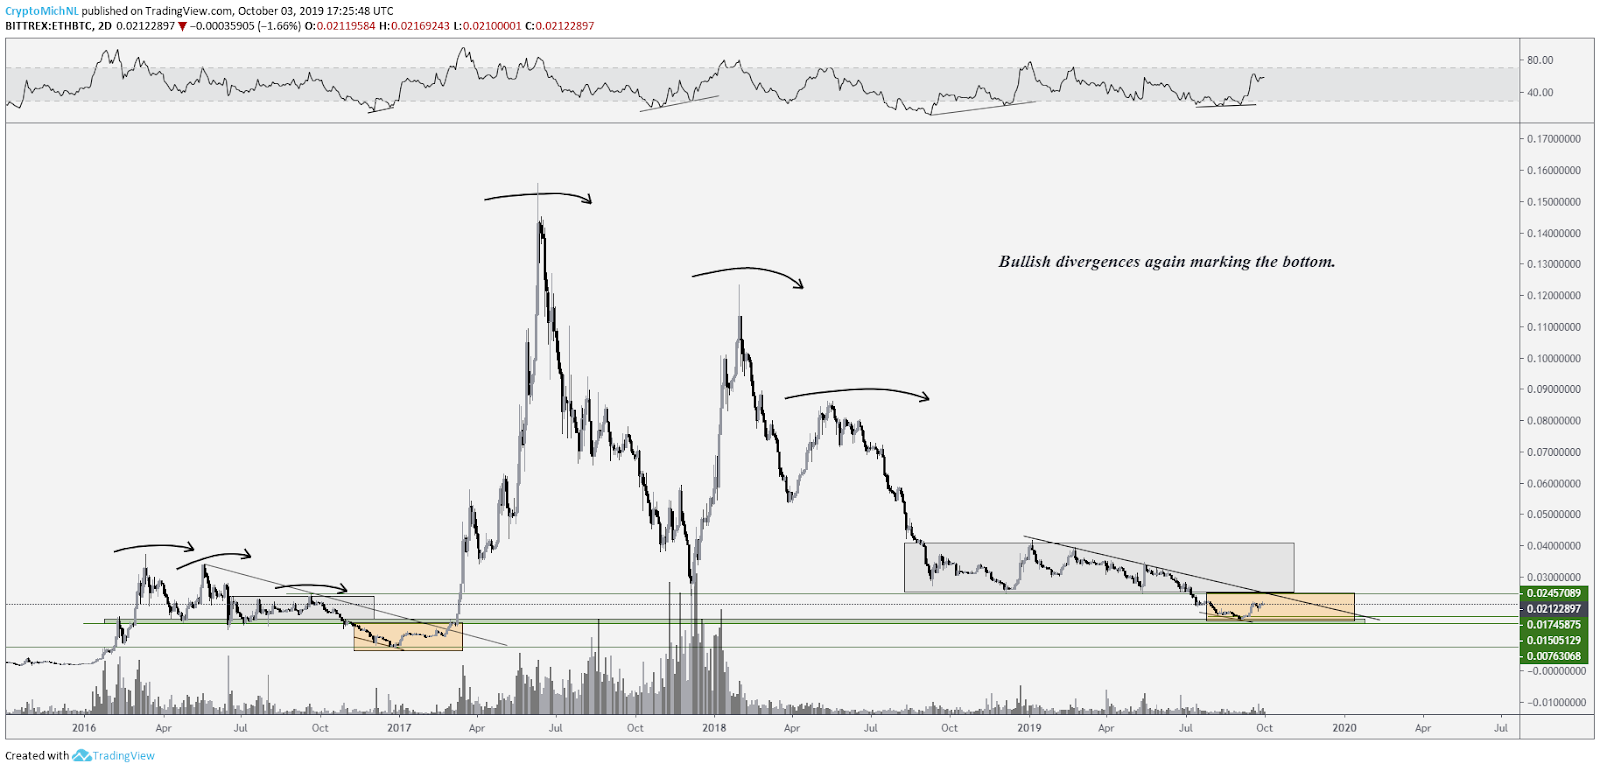
ETH/BTC Chart. Source: TradingView
Market cycles occasionally copy each other as they are essentially based on investors’ psychological behavior. Ethereum is a beautiful example and there are similarities between the 2017–2019 pattern and the 2016–2017 pattern.
The floor at 0.0245 Satoshis (sats) was broken and the next support was reached before a reversal took place. This was confirmed through bullish divergences. Every time the market makes a trend reversal, these bullish divergences can be spotted. In fact, during the summer of 2019 the same happened with the Ether/Bitcoin pair on the longer-term time frames.
Combining the study of these market cycles with the other bullish factors mentioned above (ETH 2.0 event, potential falling wedge on the ETH/USD pair), an upside breakout is likely to occur during Q4 2019. Especially given that the descending trendline will be tested during the same quarter of this year.
However, how does this line up with the altcoin dominance rate in general? Can bullish arguments be found in that chart?
Altcoin dominance slowly flips green
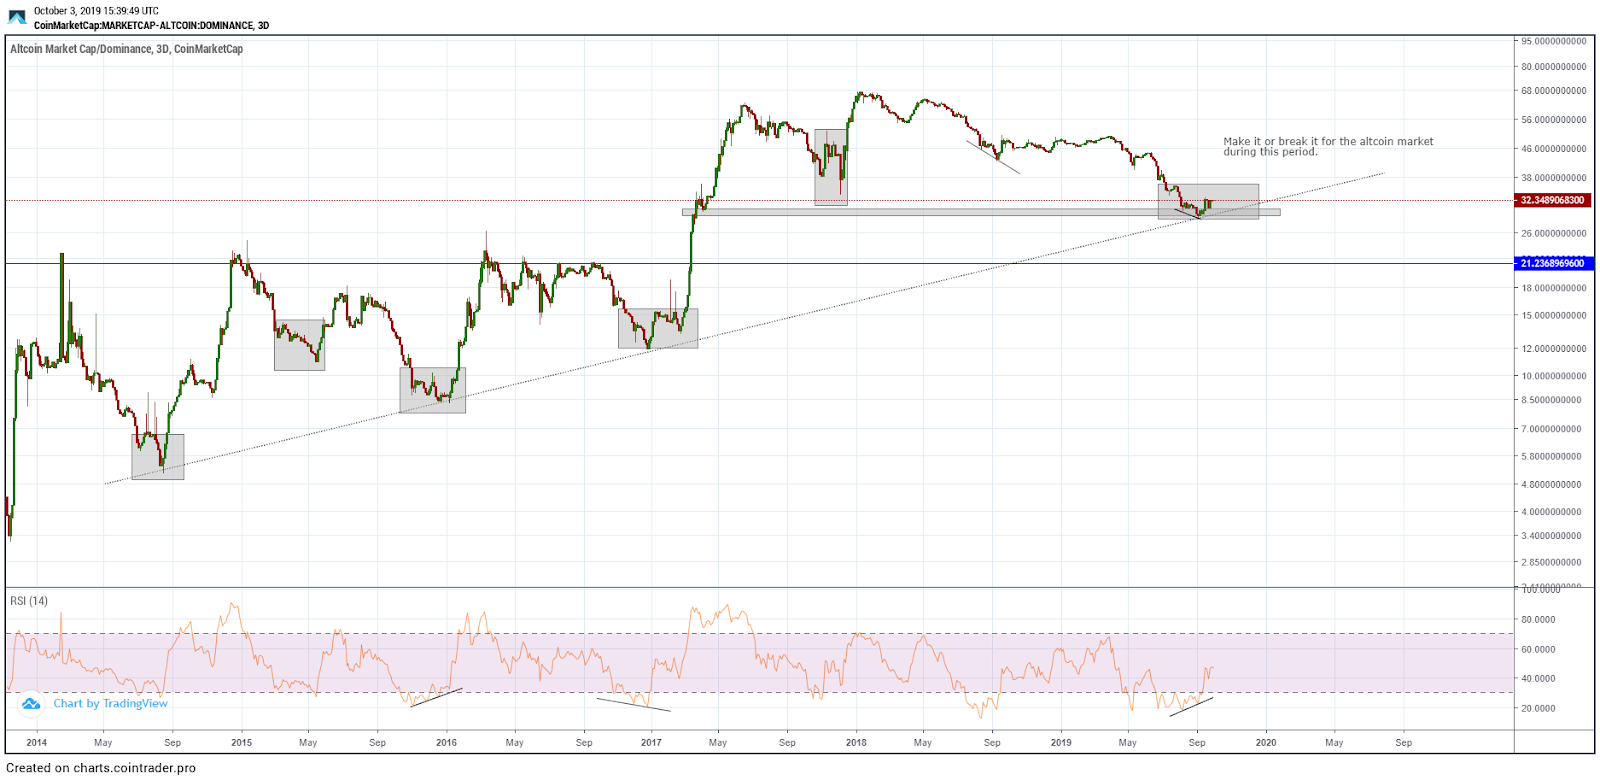
Altcoin dominance chart. Source: Cointrader.pro
Interestingly enough, the altcoin dominance chart is still holding up to the trendline, but it should be noted that the trendline can’t hold up forever as the dominance chart can’t go above 100%.
If we compare the altcoin dominance chart to previous cycles, several confluences can be found in previous periods. In every period a bullish divergence showed up before a bullish break on altcoins.
Something similar is structured in the current markets and similar bullish divergences can be observed. These divergences can also be found on important pairs like ETH/BTC, DOGE/BTC and other altcoins. This adds strength to the argument that a trend reversal could be in the making.
Bitcoin needs to break upwards
As stated previously, Bitcoin first needs to break upwards before altcoins can start outperforming it. So far, altcoins have failed to show bullish indicators during sharp downside movements from Bitcoin.
In that regard, both Bitcoin and Ethereum need to break out of their falling wedge to the upside and then a significant bullish period for altcoins might occur in Q4 2019. Confluent with the signals (bullish divergences on multiple altcoin pairs), a bullish breakout is not off the table.
From a macro perspective things are still looking fine, but some essential movements need to occur for confirmation of the market. Given that the majority of investors are expecting further downside movement on Bitcoin and crypto, something different is likely to happen.
If there is one thing that the crypto sector has shown us, it is that the majority is almost never right when it comes to calling the moves of the market.



Comments (No)